![]()

Deforestation Assessment in Nyakweri Forest Based on Very High-Resolution Airbus Imagery Analysis Using Deep Learning Model (Study 2)
Author | Ruari Bradburn, Chief Technology Officer, Langland Conservation
- Ecosystem connectivity
- Ecosystem Conversion and Restoration
- This study examined deforestation trends in Nyakweri Forest, with a particular focus on the Priority Conservation Area (PCA), utilising high-resolution Airbus imagery and AI-driven deep learning for precise detection.
- Forest cover mapping revealed severe, irreversible damage to Nyakweri Forest. Deforestation has been accelerating since 2012, leading to the fragmentation of the once-contiguous forest canopy, significantly endangering the giant pangolin's habitat and broader ecosystem.
- A staggering 70% of recent deforestation occurred within 200 meters of human settlements, highlighting the close link between land-use change and proximity to communities.
- Connectivity analysis pinpointed critical forest patches for potential reforestation corridors, carefully considering the presence of human settlements and roads to minimise conflicts and prioritise areas where community-driven restoration efforts could be most impactful.
- The study emphasises the urgent need for community-focused conservation initiatives, advocating for local engagement in forest protection and restoration to halt further habitat destruction and safeguard the forest’s ecological integrity.
- Part one of this study examined the impact of electric fences on pangolins, killing up to 2,000 every year. A specialised fence detection model was refined based on 65,000 fence examples. The model helped field teams map fences and inform community engagement and electrocution mitigation efforts.
Objectives
Methodology
For a detailed description of the object detection model and workflow, refer to the report on fence line detection here.
Analysis
The analysis was conducted in two stages. First, a broad assessment of the wider area was performed using data from the object detection model at 25% confidence, without Test Time Augmentation (TTA). Next, a detailed analysis of the Priority Conservation Area (PCA) was carried out using data from the model at 50% confidence with TTA enabled. While this approach may exclude some lower-confidence predictions, it ensures greater reliability and a significantly reduced false positive rate.
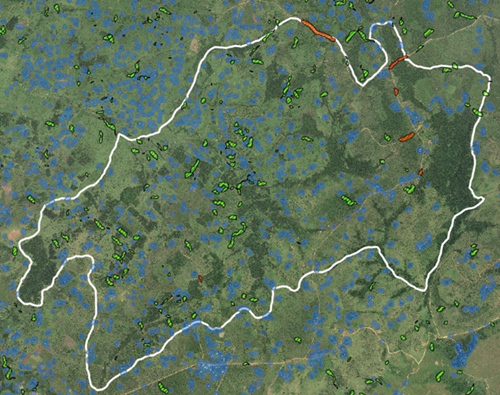
Remaining forest cover
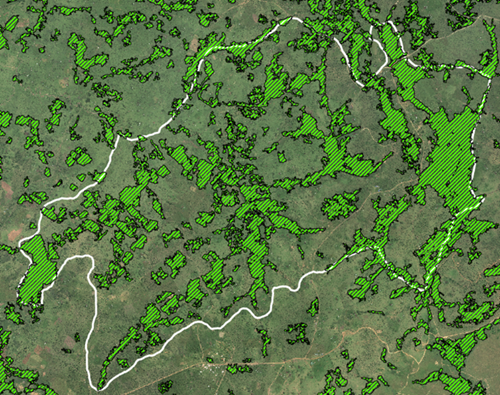
The PCA represents the largest concentration of remaining intact forest cover within the wider area. There remains substantial forest to the immediate north of the PCA, however, signs of landscape change are widespread, such as felled trees or scars on the soil from charcoal production. In the PCA, 21.3 km² of tree cover remained in March 2024 out of the area total of 49.2 km, representing 43.2% of the total area. Of this:
- 18.4 km² was comprised of areas of tree cover 1000 m² or more in size, or 37.3% of the total area.
- 12.1 km² was comprised of areas of tree cover of 0.5k m² or more in size, or 24.6% of the total area.
- 8.3 km² was comprised of areas of tree cover 1 km² or more in size, or 16.9% of the total area.
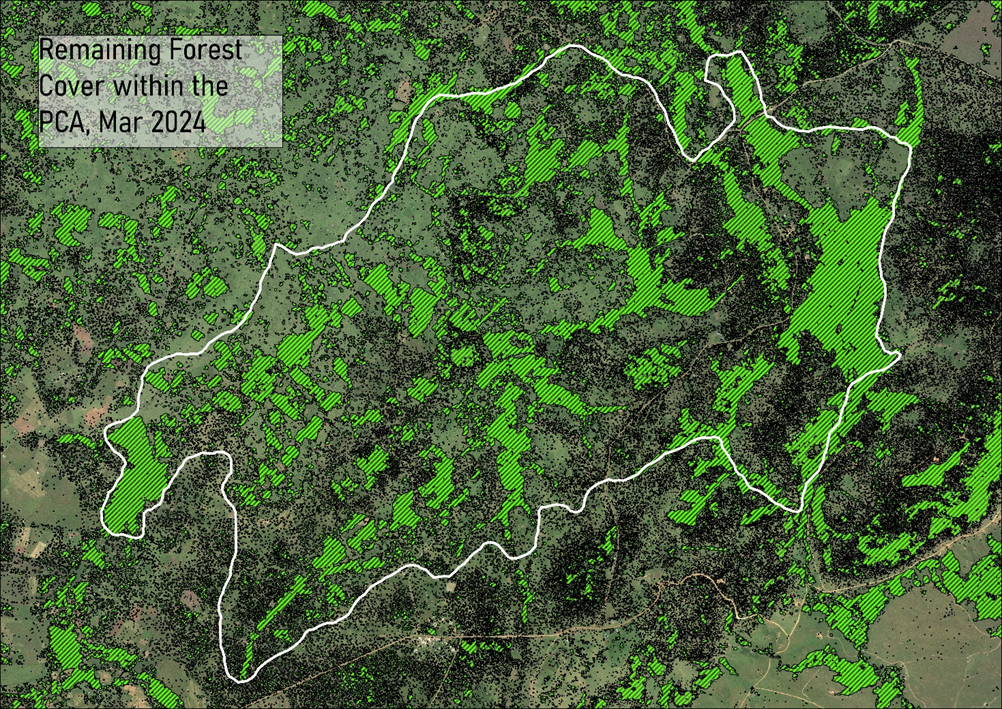
Figure 1: Remaining Forest cover in the Priority Conservation Area (PCA)
Forest loss
Forest loss is the most urgent conservation challenge in the Nyakweri Forest landscape, threatening the giant pangolin population and the overall ecosystem. Over the past two decades, deforestation has devastated the region, stripping away more than 60% of its tree cover since 2001. The most dramatic losses have occurred since 2012, following a steady southward progression.
Once a vibrant network of large contiguous forests, the area has been reduced to a mosaic of thin veins of tree cover and disconnected forest blocks. In addition to the widespread conversion of large blocks to agricultural land, there is also a consistent pattern of trees being felled in small numbers across the area, “nibbling” away at remaining forest blocks. The sum of this activity across the landscape is the consistent and continued erosion of its viability as a pangolin habitat.
Our high-resolution satellite imagery and AI-driven forest detection provide the most accurate and up-to-date assessment of remaining forest cover. The data confirms an alarming trend: deforestation and habitat fragmentation continue at an unsustainable rate, even within the PCA. Without urgent intervention, the viability of this landscape as a refuge for the giant pangolin will be lost.

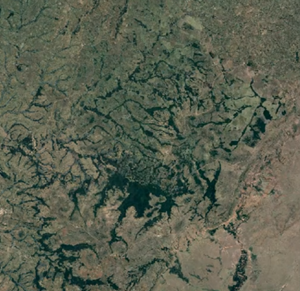
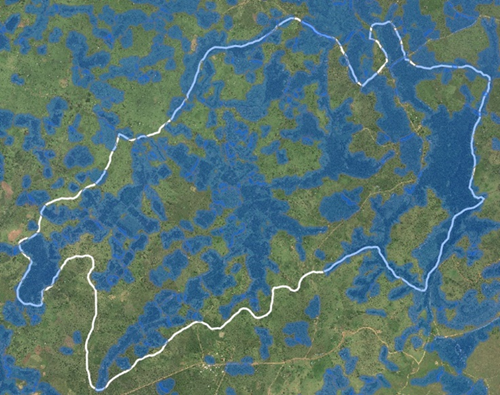
Figure 2: Showing Google Earth imagery of the Priority Conservation Area over 10 years (C) Planet-NICFI Planetscope Imagery via Google Earth Engine)
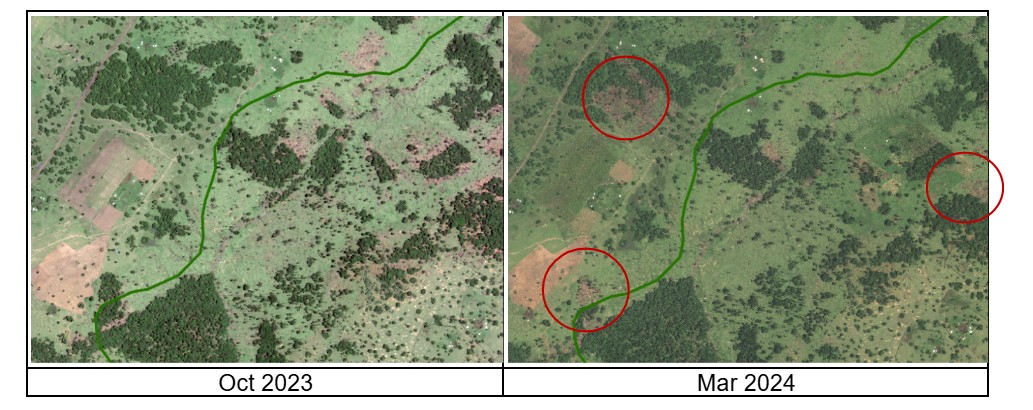
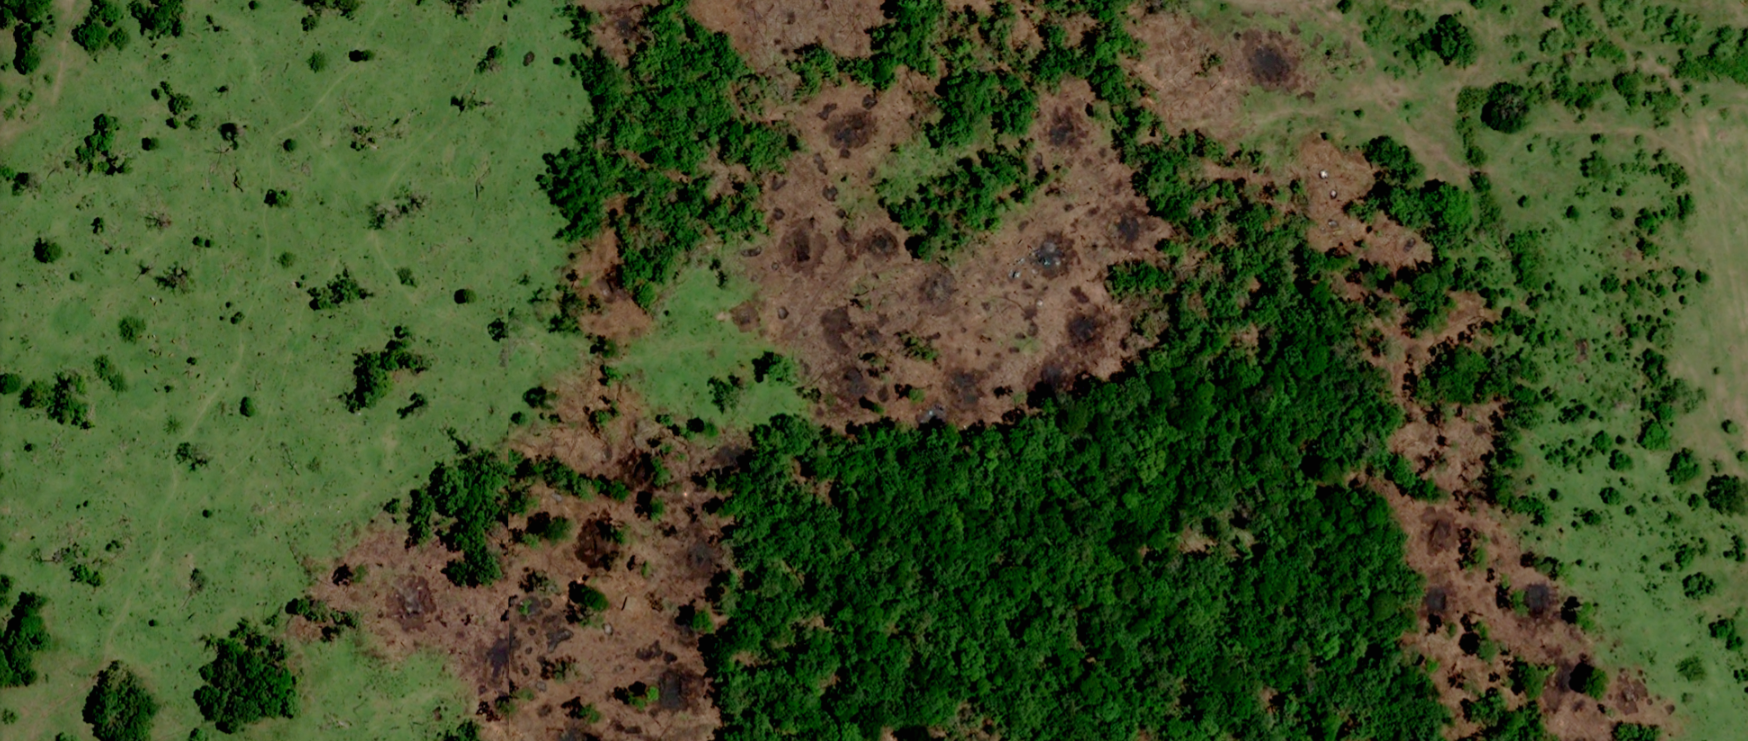
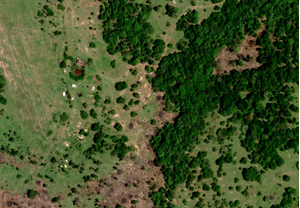
Figure 3: Examples of recent forest loss within the Priority Conservation Area (North-west corner)
|
Close up example of recent forest loss within the Priority Conservation Area |
|
 |
 |
|
Oct 2023 |
Mar 2024 |
Figure 4: Showing a close-up example of forest loss in the Priority Conservation Area
Our imagery captures different sections of the Nyakweri Forest at varying times, making a high-resolution, comprehensive analysis challenging. However, key areas of overlap exist between imagery dates, covering 29.8 km² of the PCA. This overlap allows for an effective change analysis across 72% of the PCA.
Seasonal variability between the two imagery dates complicates precise loss measurements, as the rainy season leads to lusher, denser vegetation in spring. Despite this, the total detected tree cover remained virtually identical across both dates. However, when smaller trees were excluded and only blocks of at least 100 m x 100 m were analysed, the process became significantly more effective in pinpointing areas of potential loss for manual verification.
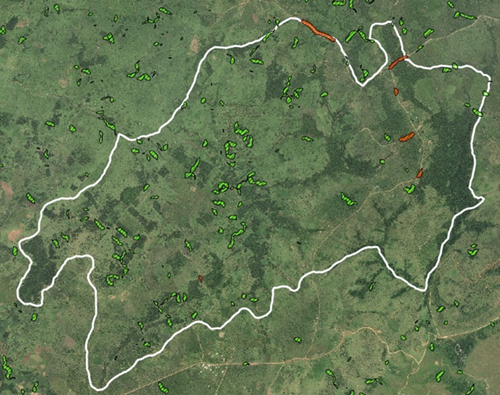
A different map was created, marking areas of loss between the October imagery in red.
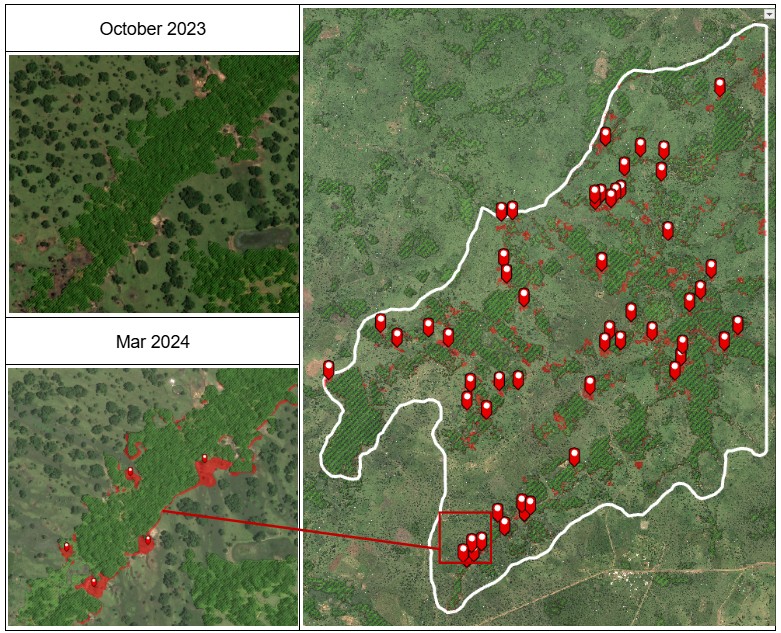
Figure 5: Showing manually confirmed sites of forest block loss between October 2023 and March 2024
Most large area loss detections usually correlated to ongoing felling of the remaining forest blocks and rapidly improved the rate and reliability with which they could be detected. After manually verifying felling activity the prevalence of scars left behind by other previous felling activity underlines a persistent and historic pattern of loss.
We identified buildings within the PCA and next analysed their proximity to areas of confirmed recent deforestation. The process involved:
- Identifying clusters of buildings (potential settlements or homesteads)
- Creating buffer zones around recent deforestation sites (100 m radius)
- Intersecting these buffer zones with the identified building clusters.
Findings
This analysis revealed several key findings:
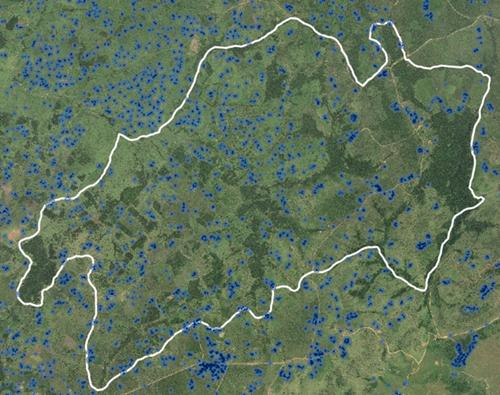
- 70% of the recent deforestation sites were within 200 m of buildings.
- There remains very little space within the PCA where there remain large gaps between buildings – 87% of the PCA falls within 300 m of a building. The 13% of the PCA that falls out of 300 m proximity of a building accounts for 20% of the remaining tree cover and 22% of the remaining tree cover in blocks larger than 100 m x 100 m.
- In the areas where buildings were further away, there were visible signs of historic deforestation between the buildings and the deforestation sites, indicating a continued pattern of erosion.
Due to the fragmented nature of the habitat and the presence of communities throughout the priority area, a community-centric approach—like that adopted by The Pangolin Project—must be central to broader conservation efforts. Collaborating with local communities, fostering positive attitudes toward conservation and incentivising the protection of the remaining forest are key strategies for mitigating further damage.
This analysis has identified which communities sit in close proximity to active sites of deforestation, where trees were felled between October 2023 and March 2024.

Figure 6: Showing clusters of households in proximity to recent areas of deforestation
Connectivity analysis
The connectivity analysis aims to identify and prioritise areas with limited potential reforestation efforts to improve habitat connectivity for wildlife, particularly the giant pangolin. Connectivity analysis was conducted as follows:
1) Identifying significant forest patches
- Tree cover areas larger than 100 m x 100 m² (10,000 m²) were identified as significant forest patches.
- A 50 m buffer was drawn around these significant forest patches.
2) Identifying potential connection areas
- The intersecting areas of these buffers were kept, as they represent potential corridors between forest patches.
- Areas, where these intersections crossed roads, were highlighted in red, indicating potential wildlife crossing points, as well as where reforestation efforts are likely unfeasible due to the importance of the road to local communities.
3) Accounting for human settlements
- A 50 m buffer was created around households (buildings).
- This household buffer was then erased from the tree-cover intersections.
4) Identifying priority areas for community engagement
- The resulting areas represent potential reforestation zones that could connect existing forest patches while minimising conflict with human settlements.
- These areas are highlighted as priority locations for engaging local communities in reforestation efforts.
|
Connectivity analysis |
|
|
Tree cover areas above 100 x 100 m² identified |
50 m buffer drawn |
 |
 |
|
Intersecting areas kept (red where over roads) |
50 m buffer over households |
 |
 |
|
Household buffer erased from tree cover intersect |
Communities to engage regarding reforestation |
 |
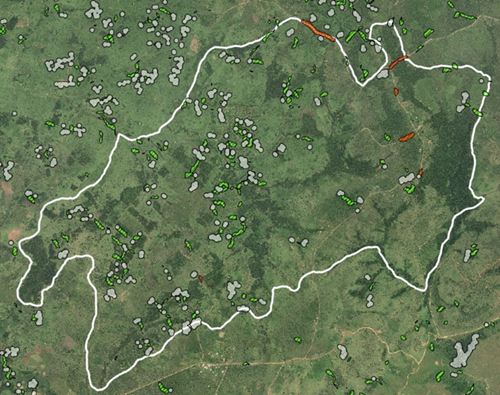 |
Figure 7: Showing connectivity analysis in the Priority Conservation Area
Conclusion
The analysis identified critical gaps in forest cover that require urgent restoration to enhance habitat connectivity significantly. The most promising opportunities for reforestation are in the central and western regions of the Priority Conservation Area, while the most intact forest block lies to the east. However, a major road presents a significant barrier to reconnecting this area with the rest of the landscape. Additionally, the analysis pinpointed high-risk areas, such as road crossings, where wildlife movement between forest patches has been compromised, enabling targeted mitigation efforts. Furthermore, it provides a data-driven framework to prioritise reforestation initiatives and community engagement, ensuring that conservation interventions are strategic and impactful.
Langland Conservation
Project Lead
Ruari Bradburn
Langland Conservation is a UK-registered charity that specialises in using data analytics and technology to support a range of conservation partners.
Their work focuses on using data-driven insights to help decision-makers achieve greater results in conservation, empowering others to leverage technology in conservation efforts and supporting investigations to tackle organised wildlife crime worldwide.